Infographics are a great way to visually present complex data in an easy-to-understand format. Whether you’re a marketer trying to snag new customers or a blogger who wants to engage readers with compelling content, infographics can help you achieve your goals.
You barely need design skills because good graphic software will allow you to create infographics for free. But the job can still be time-consuming - it’s gathering the data and how you lay it all out that’s daunting. So here's how to create infographics for free for your site. Would you care to give it a try?

What Is an Infographic?
An infographic is a visual representation of data. It can be created in a variety of formats, such as charts and graphs, and can be used to explain concepts or highlight important points. But the aim of an infographic is to illustrate a simplified version of complex information so that viewers can digest it easily. Each infographic should have one main subject, and all the elements within the infographic should be related to the subject.
What Makes a Good Infographic?
Graphic design is a critical component of any infographic and successful infographics have a clear, concise layout that is easy to understand. Additionally, infographics need to be visually appealing and engaging. It means that the graphic elements should not be cluttery (all over the place). And finally, make sure all your data is accurate and up-to-date - an infographic that’s outdated or inaccurate will quickly lose credibility.
Here are some tips for creating successful infographics:
Use a clear, concise layout:
A good infographic should be easy to understand, with clear sections and well-organised data. So try to keep the text to a minimum.
Use plenty of graphic elements:
Visual appeal is key for an engaging infographic, so use plenty of graphic elements to draw attention to key information. Graphics can include charts, images, and cartoons - whatever works best to communicate your message.
Display the source of information:
Make sure all your data is accurate and up-to-date at the time of publishing your infographic. Outdated or inaccurate data will quickly lose credibility. The best you can do is to display where you get the information from. Place a link to the relevant original site, so at least you can prove that you are not making up any part of the data.
In any way, it’s essential that you check your data against reliable sources before you start designing.
Don’t forget to mention your brand
Infographics can be a great way to promote your brand and attract attention to your important messages. By using an infographic, you’ll get people interested in what you have to say, and you’ll also show that you’re a serious player in the market.
But more importantly, you don’t want someone else to claim the authorship of your infographic. So place your brand name and logo somewhere in the infographic clearly.
How To Create an Infographic

Here are the steps to creating an infographic.
- Choose a subject that interests you. Make sure you know what you want it to accomplish. What are the key points you want to communicate? What information do you want to include?
- Plan a big picture: prepare a detailed outline of your article before starting to create your infographic. This will help you stay organized and make sure all the information is included in your infographic.
- Select data: Once you have a clear idea of your goals, you can start gathering data to support them. Select information that is relevant and interesting to your audience. Use data that’s clear and makes good sense to you. Make sure all the data in your infographic is accurate and current.
- Ideally, you should give an SEO-friendly title to your infographic so that it will be picked up by search engines. Use a keyword search tool to find the most appropriate, long-tail keyword.
- Choose a graphics program to create your infographic with. There are some great free programs available online. I’ll come back to this one.
- Choose a template and reorganise the data according to the layout - which data should be displayed where, and in what order.
- Use clear graphic elements (from a template or free .png images) and easy-to-read fonts to create an attractive infographic.
- Add the creator’s information (that’s you), and/or your logo.
- Add the URLs of the information sources at the end of the infographic.
Which Graphic Software Should You Use?
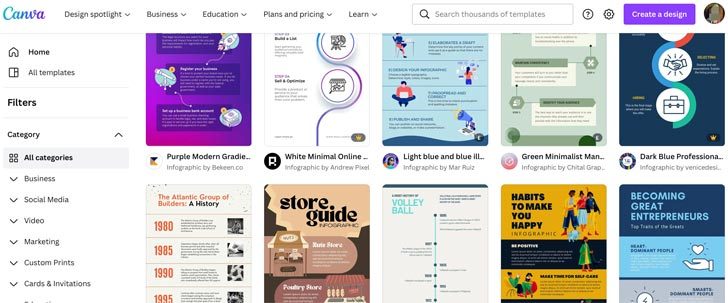
Here is some graphic software with infographic templates. They are all free to use but with limited access. The premium options will allow you to use any temple an unlimited number of times.
Canva

Canva is a free, online design platform that lets users create professional-grade graphics and photos. Canva’s free features are quite comprehensive, but some of the paid features offer additional capabilities and flexibility. There are plenty of infographic templates but only some of them are free to use. But the paid plan offers access to amazing templates and a wider range of colours and fonts. Overall, Canva is an excellent choice for creating infographics. Canva’s features include:
- Design Options: Canva's interface is packed with features that allow you to create stunning infographics that look like those found on professional websites.
- Extensibility: Canva's platform is extremely extensible, allowing you to add custom code or graphics to make your infographics even more powerful.
- Number of Users: Canva boasts a huge user base, meaning that you're likely to find help and support if you need it.
- Number of Versions: Canva allows you to create multiple versions of your infographic, allowing you to test different ideas before settling on a final version.
- Customizable: Canva's platform is fully customizable, allowing you to change the colours, fonts, and images used in your infographic.
Piktochart
As the Piktochart’s tagline says “Information design simplified”, the program is great for creating infographics, and it’s super-easy to use. Just drag and drop your data into the tool, and you’re good to go. The features include:
- Wide range of templates and designs: You can easily create stunning visuals with Piktochart, whether you need a simple infographic for your website or something more elaborate for an advertising campaign.
- Highly customizable: You can control every aspect of your infographic, from the colours and fonts used to the layout and design. This means that you can create infographics that look exactly the way you want them to.
- Great for creating visual summaries: Piktochart can be used to create visual summaries of your data, which can be very helpful in communicating your findings effectively.
- Included data analysis features: Piktochart includes powerful data analysis features that make it easy to explore your data and understand its significance.
Fotor
Fotor is primarily designed to edit photos but it also allows you to create infographics. Fotor’s main appeal is its simplicity; it doesn’t have as many bells and whistles as other photo editors, but it’s easy to use and provides all the basic tools needed to edit photos.
Fotor also has a wide range of features for manipulating images, including cropping, adding text or filters, and exporting them in a variety of formats. Overall, Fotor is also a good choice for creating basic infographics.
Get People To Share Your Infographics
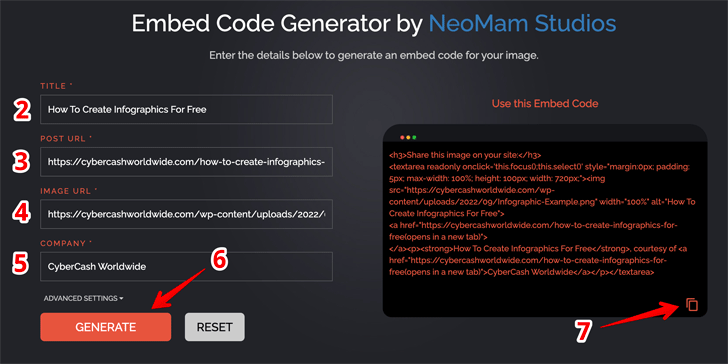
Using an embed code generator program is a great idea to promote your infographic on your site. I use NeoNam Studios, it's free and easy. I'll show you.
Let's say the image below is an infographic I created and uploaded on this site.
The image is uploaded on the URL: https://cybercashworldwide.com/wp-content/uploads/2022/09/Infographic-Example.png
- 1First, visit https://neomam.com/embed-code.

- 2Type in the title of your post where you embedded your infographic.
- 3Copy & past your post URL.
- 4Copy & past your image (infographic) URL.
- 5Type in your company name.
- 6Click "Generate".
- 7The code will be generated on the right-hand side. Click the "copy" icon in the bottom-right corner.
- 8Now come back to your site builder. On the HTML mode, paste the code.
That's it, the box like this below will show up.
Share this image on your site:
This code will allow your visitors to click, copy and embed it on their website. And when they do - it will show up like this on their site;
Write a Blog Post for SEO Purposes
To add extra information to your infographic, you want to add some text on the same page. As I mentioned earlier - ideally - the title of your infographic should be long-tail, low-competition keywords. So the text length on your page should also be at least 300-600 words so that the page will be indexed and ranked on Google.
You've already researched the data for the infographic, so you know what to elaborate on - stick to the topic, and don't forget to include that specific keyword in your text.
How To Create Infographics For Free - Wrap Up
If you're looking to create more engaging content for your website or blog, infographics can be a great way to do it. I hope this post has helped you to learn how to create an infographic, and has given you some tips on how best to use them. If you have any questions, don’t hesitate to leave a comment below. Good luck!


The post was really very good. Thanks for sharing.
Thanks for your comment Amit, but why did you think so? Share your thoughts with us!